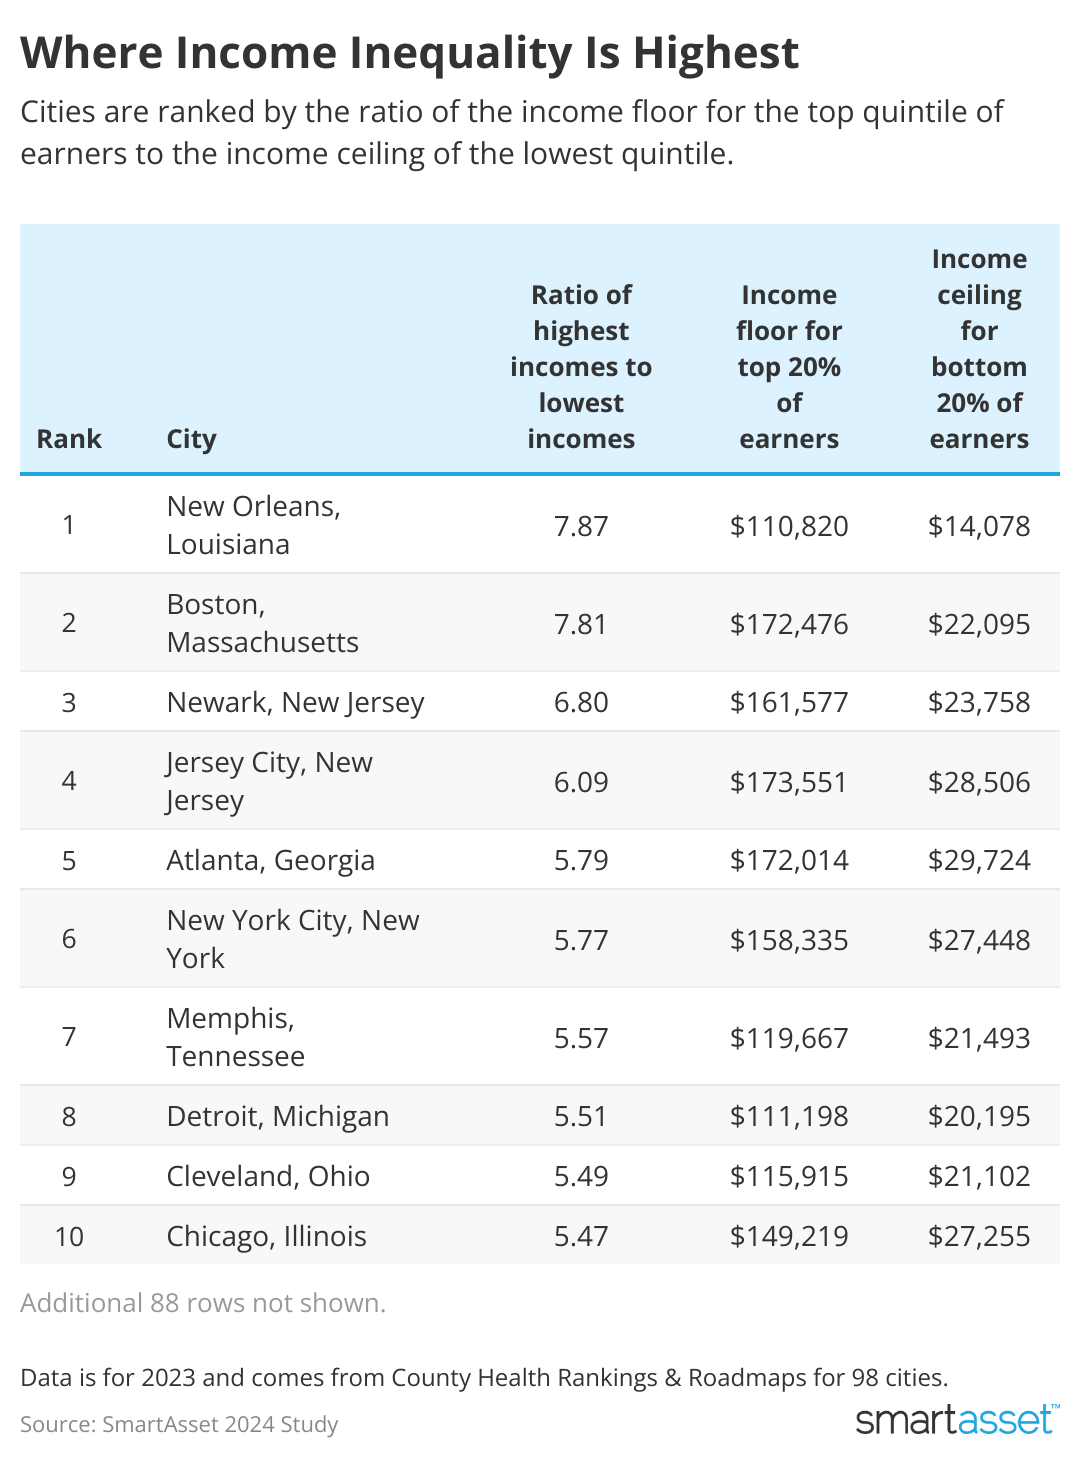

On average, the uppermost 80% of households earn more than four and half times what the bottom 20% earns. For example, in one city, the highest-earning households may average $140k annually or higher – compared to a $30k income earned by the bottom fifth of residents. This income inequality can divide local communities by creating disparities in housing, goods and services.
With this in mind, SmartAsset ranked 98 of the largest U.S. cities by the size of their income inequality, measured by comparing the incomes of the top 80% of earners with the bottom 20%.
To determine cities where income inequality is highest, cities are ranked by the ratio of the income floor for the top quintile of earners to the income ceiling of the lowest quintile.
Data and methodology
Cities were ranked by the ratio of household income at the 80th percentile to those of the 20th percentile. Data is for 2023 and comes from County Health Rankings & Roadmaps. Based on Census Bureau population data for 2022, 98 of the largest U.S. cities for which data was available were included. Cities were mapped to county-level data.
This story was produced by SmartAsset and reviewed and distributed by Stacker Media.